Monday, June 2, 2025

Cloud Watch

 Cloud Watch

Class 37th AWS Cloud Watch June2nd

How many steps to create one instance in amazon ?

7 steps:

1.Instance name:

2.AMI: Image 

3.Instance type : t2.micro

4.Key pair

5.Security group :Network 

6.Configuratin of storage 

7.Advance details

Monitoring 

What is monitoring 

Monitoring is the process of continuously Observing measuring, and  analyzing systems, applications,

Monitoring ensure they operate efficiently ,securely, and without disruptions.

Monitoring identify performance issues ,cyber threats and unauthorized access.

Importance of monitoring

Early Issue Detection: Helps in identifying problems before critical failures.

Business Continuity: Minimizes downtime and improves service availability.

User Experience :Ensures a smooth and reliable experience for end users 

Type of monitoring 
01 . IT & INFRASTRICTURE MONITORING
Server monitoring
Network monitoring
Database monitoring 
Cloud monitoring 
Application Performance monitoring 
02. SECURITY MONITORING 
Log monitoring 
Endpoint monitoring
SIEM monitoring
03. BUSINESS  & MARKETING MONITORING 
Website monitoring
Social media monitoring 
Competitor monitoring 
Customer feed back

Step1:
If you create any instance in AWS by default Cloud monitoring 


Step2:
Below script for website launch
[ec2-user@ip-10-0-0-222 ~]$ sudo -i
[root@ip-10-0-0-222 ~]# vi amazon.sh
[root@ip-10-0-0-222 ~]#  [New] 9L, 232B written
[root@ip-10-0-0-222 ~]# cat amazon.sh
#! /bin/bash
yum install httpd git -y
systemctl start httpd
systemctl status httpd
cd /var/www/html
git clone https://github.com/Ironhack-Archive/online-clone-amazon.git
mv online-clone-amazon/* .
tail -f /var/log/httpd/access_log
[root@ip-10-0-0-222 ~]# sh amazon.sh
Step3: Using Public ip for the instance launch the website

Step3: Create a dashboard 

Click >Cloud watch >Click Dashboard >Create Dashboard

Give any Dash board name :Amazon

Metrics :Metric means (Cpu,Ram,disk) consume ,You can choose whatever type,line take as of now

click next 

You need select which one you need monitor ,for us now Ec2 

> Select Per-Instance Metric ,Search with your instance id and select the cpu utilization, Click create widget and then Click Save 

Step4: See below Utilization,9% reached 
Step5:
Giving stress to server manually

[ec2-user@ip-10-0-1-102 ~]$ sudo -i
[root@ip-10-0-1-102 ~]# amazon-linux-extras install epel -y

[root@ip-10-0-1-102 ~]# yum install stress
 below command give manually stress for the server 

[root@ip-10-0-1-102 ~]#stress

Below command next 100s give to stress for my server 

[root@ip-10-0-1-102 ~]# stress --cpu 8 --io 4 --vm 2 --vm-bytes 128M --timeout 100s

We can choose widget type, choose number 

Given 1000s seconds

[root@ip-10-0-1-102 ~]# stress --cpu 8 --io 4 --vm 2 --vm-bytes 128M --timeout 1000s

Investigate is AMI need enabled it is paid


CREATE ALARM
Step1: SNS(Simple network service)

>Cloud watch >Alarm >In alarm 

Click next select stop the instance when reach server above 50 % 


Create Topic,it will give the alert to email notification,click create topic 
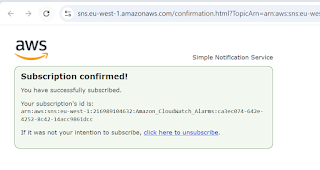
After Click create topic you will subscription confirmation to you email ,click  that confirmation 


After confirmation, your received below 

select you notification which you have created.
Click Next > give Alarm name any >Create Alarm 
Alarm created Successfully


Step2: Need give Manually stress and check again 

[root@ip-10-0-1-102 ~]# stress --cpu 8 --io 4 --vm 2 --vm-bytes 128M --timeout 1000s


Step3: You will get notification email 

Step4: Instance was stopped 

Step5:Without stopping , you can removed stop Ec2, you will get only email


                                                               Prometheus Monitoring Tool

Prometheus Grafana Created in 20 seconds with below script 

Step1: After executed the script 

https://github.com/RAHAMSHAIK007/all-setups/blob/master/prometheus.sh

[root@ip-10-0-1-102 ~]# sh prometheus.sh

Step2: launch your publicip ,prometheus

http://18.201.137.228:9090/


Step4: Grafana


--Thanks

No comments:

Post a Comment